Last updated May 20, 2025

| 1. | Arizona | 5,755 kJ/m² | |
| 2. | New Mexico | 5,642 kJ/m² | |
| 3. | Nevada | 5,296 kJ/m² | |
| 4. | Texas | 5,137 kJ/m² | |
| 5. | California | 5,050 kJ/m² | |
| 6. | Colorado | 4,960 kJ/m² | |
| 7. | Oklahoma | 4,912 kJ/m² | |
| 8. | Kansas | 4,890 kJ/m² | |
| 9. | Utah | 4,887 kJ/m² | |
| 10. | Florida | 4,859 kJ/m² | |
| 11. | Arkansas | 4,725 kJ/m² | |
| 12. | Louisiana | 4,725 kJ/m² | |
| 13. | Mississippi | 4,693 kJ/m² | |
| 14. | Nebraska | 4,685 kJ/m² | |
| 15. | Georgia | 4,661 kJ/m² | |
| 16. | Alabama | 4,660 kJ/m² | |
| 17. | South Carolina | 4,624 kJ/m² | |
| 18. | Missouri | 4,545 kJ/m² | |
| 19. | Tennessee | 4,486 kJ/m² | |
| 20. | Wyoming | 4,471 kJ/m² | |
| 21. | North Carolina | 4,466 kJ/m² | |
| 22. | Kentucky | 4,383 kJ/m² | |
| 23. | Illinois | 4,380 kJ/m² | |
| 24. | Virginia | 4,354 kJ/m² | |
| 25. | South Dakota | 4,332 kJ/m² | |
| 26. | Iowa | 4,331 kJ/m² | |
| 27. | Indiana | 4,318 kJ/m² | |
| 28. | Maryland | 4,267 kJ/m² | |
| 29. | Idaho | 4,251 kJ/m² | |
| 30. | Delaware | 4,232 kJ/m² | |
| 31. | West Virginia | 4,146 kJ/m² | |
| 32. | Ohio | 4,139 kJ/m² | |
| 33. | New Jersey | 4,056 kJ/m² | |
| 34. | Wisconsin | 4,023 kJ/m² | |
| 35. | Michigan | 4,018 kJ/m² | |
| 36. | Rhode Island | 3,989 kJ/m² | |
| 37. | Connecticut | 3,988 kJ/m² | |
| 38. | Minnesota | 3,968 kJ/m² | |
| 39. | Massachusetts | 3,944 kJ/m² | |
| 40. | Pennsylvania | 3,939 kJ/m² | |
| 41. | North Dakota | 3,925 kJ/m² | |
| 42. | New York | 3,904 kJ/m² | |
| 43. | New Hampshire | 3,891 kJ/m² | |
| 44. | Montana | 3,847 kJ/m² | |
| 45. | Oregon | 3,830 kJ/m² | |
| 46. | Vermont | 3,826 kJ/m² | |
| 47. | Maine | 3,815 kJ/m² | |
| 48. | Washington | 3,467 kJ/m² |
Sunny days bring more than just good vibes. Sunshine catalyzes life on Earth, facilitating critical processes like photosynthesis, weather patterns, and even our mental health. Moreover, in an era of ever-increasing technological sophistication, sunlight is a promising source of clean, renewable energy. As our world shifts towards more sustainable methods of power generation, identifying the sunniest regions becomes imperative. For those intrigued by solar energy, especially for powering their homes, knowing where the sun shines the most within the U.S. can guide both living choices and investments.
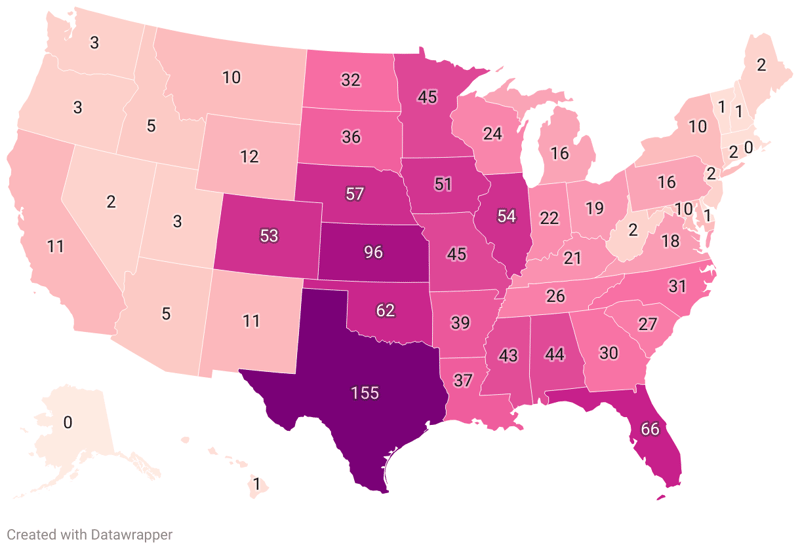
Our data is based on the average annual sunlight, measured in kilojoules per square meter (kJ/m²).
The most sun-drenched state in the U.S. is Arizona, where the average annual sunlight measures a radiant 5,755 kJ/m². Arizona's tranquil desert climate and clear skies give it an unrivaled advantage in terms of solar power potential, which is increasingly recognized and utilized in energy plans across the state.
Not far behind is New Mexico, with its average annual sunlight hitting 5,642 kJ/m². Nevada is the third sunniest state, receiving an annual average of 5,296 kJ/m² of sunlight. Next in line is Texas and California, each with a yearly sunlight average above 5,000 kJ/m², scoring 5,137 and 5,050 kJ/m² respectively. While not exceeding the 5,000 kJ/m² mark, states like Colorado, Oklahoma, Kansas, Utah, and Florida each receive ample sunlight, between 4,859 and 4,960 kJ/m² annually.
Ten Sunniest States (average annual sunlight):